I’ve recently released two new data packages for R - read on to learn more about them.
I’ve spent some time recently building a couple of new data packages. I was inspired by coming across a dataset by tech magazine ‘The Hustle’. They collated a dataset called “The Hustle’s iPhone vs. Android Survey” which surveys peoples phone preferences. In analysing this data I found it had a field that reported the city the respondent was from. I thought it would be interesting to pull in additional data about the city, which lead to me needing a list of cities and their associated metadata. The upshot of this is I’m now announcing two new packages: worldcities and phonewar.
worldcities
worldcities is a repacking of a dataset provided by SimpleMaps (https://simplemaps.com/data). It contains a dataset of 40,000 cities and associated metadata such as coordinates, country, and population.
You can install it from my github account
remotes::install_github("condwanaland/worldcities")As with any package, we can load it with library(). At the same time we’ll also load some extra packages for using later
library(worldcities)
library(dplyr)
library(ggplot2)
library(rnaturalearth)
library(rnaturalearthdata)
library(plotly)
You can then access its data by calling data().
data("worldcities")
head(worldcities)
## city lat lng country iso2 iso3 admin_name capital
## 1 Tokyo 35.6897 139.6922 Japan JP JPN Tokyo primary
## 2 Jakarta -6.2146 106.8451 Indonesia ID IDN Jakarta primary
## 3 Delhi 28.6600 77.2300 India IN IND Delhi admin
## 4 Mumbai 18.9667 72.8333 India IN IND Maharashtra admin
## 5 Manila 14.6000 120.9833 Philippines PH PHL Manila primary
## 6 Shanghai 31.1667 121.4667 China CN CHN Shanghai admin
## population id
## 1 37977000 1392685764
## 2 34540000 1360771077
## 3 29617000 1356872604
## 4 23355000 1356226629
## 5 23088000 1608618140
## 6 22120000 1156073548Lets plot the ten most populous cities.
# This grabs a map of the world from the `rnaturaldata` packages
world <- ne_countries(scale = "medium", returnclass = "sf")

top <- worldcities %>%
  slice_max(population, n = 10)

ggplot(data = world) +
  geom_sf() +
  geom_point(data = top,
             aes(x = lng, y = lat, colour = city), size = 2) +
  coord_sf()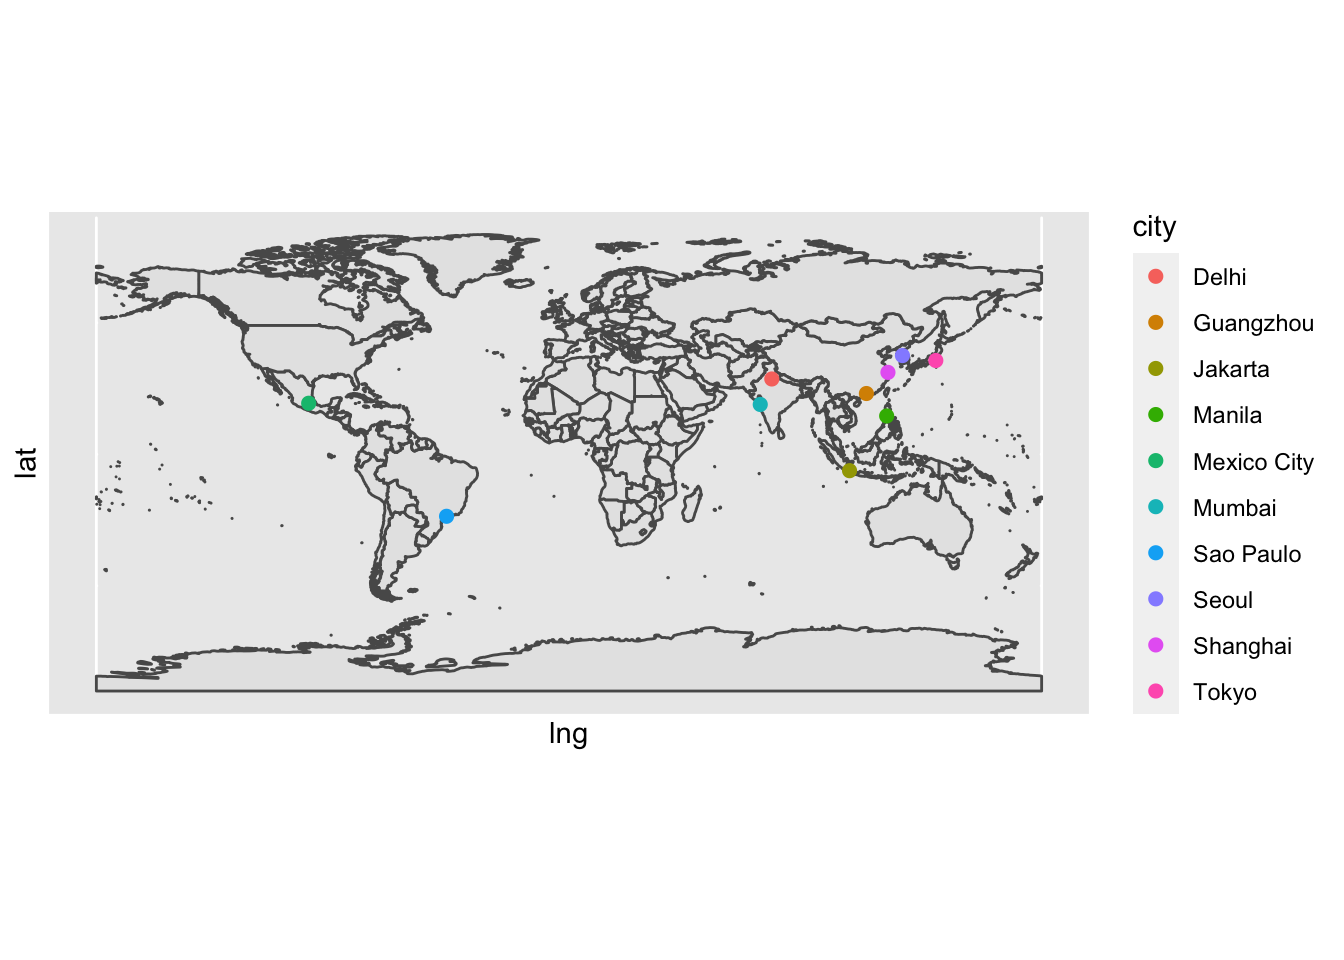
phonewar
The second data package I’ve released recently is titled phonewar.
phonewar provides a dataset containing people’s iPhone vs Android preferences based on a survey done by tech magazine ‘The Hustle’ (https://thehustle.co/home/). The survey asked people to fill out:
- Do they use Android or iPhone
- Their reason for their choice
- Whether they have considered switching
- Whether they have less respect for people using the other type of phone
- Which city they come from
I’ve enriched this data by cleaning up the ‘city’ responses and adding in extra information about the city (i.e., country and population). For those wondering, yes, it uses worldcities to get this extra data. Cleaning up the city names was a challenging and interesting problem which I’ll write about in a future blog post.
phonewar can also be installed from my github
remotes::install_github("condwanaland/phonewar")Then you can load the phonedata dataset
library(phonewar)
data("phonedata")
head(phonedata)
## # A tibble: 6 × 11
## # Groups: key [6]
## key phone_type reason considered_swit… less_respect_fo… original_city city
## <int> <chr> <chr> <chr> <chr> <chr> <chr>
## 1 1 Android Cost No No spokane spok…
## 2 2 iPhone Ecosys… Yes No marbella spa… marb…
## 3 3 iPhone Ease o… Yes No cork cork
## 4 4 Android I star… No No ottawa otta…
## 5 5 iPhone Too ma… No No manchester, … manc…
## 6 6 iPhone Ease o… No No bangkok bang…
## # … with 4 more variables: lat <dbl>, lng <dbl>, country <chr>,
## # population <dbl>Lets create a plot of their summary statistics
library(viridis)
library(patchwork)
phone_sum <- phonedata %>%
  group_by(phone_type) %>%
  summarise(n = n()) %>%
  mutate(pct = n/sum(n))

g1 <- ggplot(phone_sum, aes(y = phone_type, x = pct, fill = phone_type)) +
  geom_col() +
  labs(caption = "A: Ownership percentage")

cons_switch <- phonedata %>%
  select(phone_type, considered_switching) %>%
  group_by(phone_type, considered_switching) %>%
  summarise(n = n()) %>%
  group_by(phone_type) %>%
  mutate(pct = prop.table(n) * 100) %>%
  filter(considered_switching == "Yes")


g2 <- ggplot(cons_switch, aes(y = phone_type, x = pct, fill = phone_type)) +
  geom_col() +
  labs(caption = "B: % of owners who have considered \n switching to the other phone type")


respect <- phonedata %>%
  select(phone_type, less_respect_for_other) %>%
  group_by(phone_type, less_respect_for_other) %>%
  summarise(n = n()) %>%
  group_by(phone_type) %>%
  mutate(pct = prop.table(n) * 100) %>%
  filter(less_respect_for_other == "Yes")

g3 <- ggplot(respect, aes(y = phone_type, x = pct, fill = phone_type)) +
  geom_col() +
  labs(caption = "C: % of owners who have less respect \n for people with the other phone type") +
  theme(axis.title.y=element_blank())

g1 / (g2 | g3) +
  plot_layout(guides = "collect") +
  plot_annotation(tag_levels = "A") &
  geom_text(aes(label = paste0(round(pct, 3), "%"), hjust = 1.2), color = "grey") &
  scale_fill_viridis(discrete = TRUE, option = "turbo") &
  theme(
        axis.text.y=element_blank(),
        axis.ticks.y=element_blank()
        )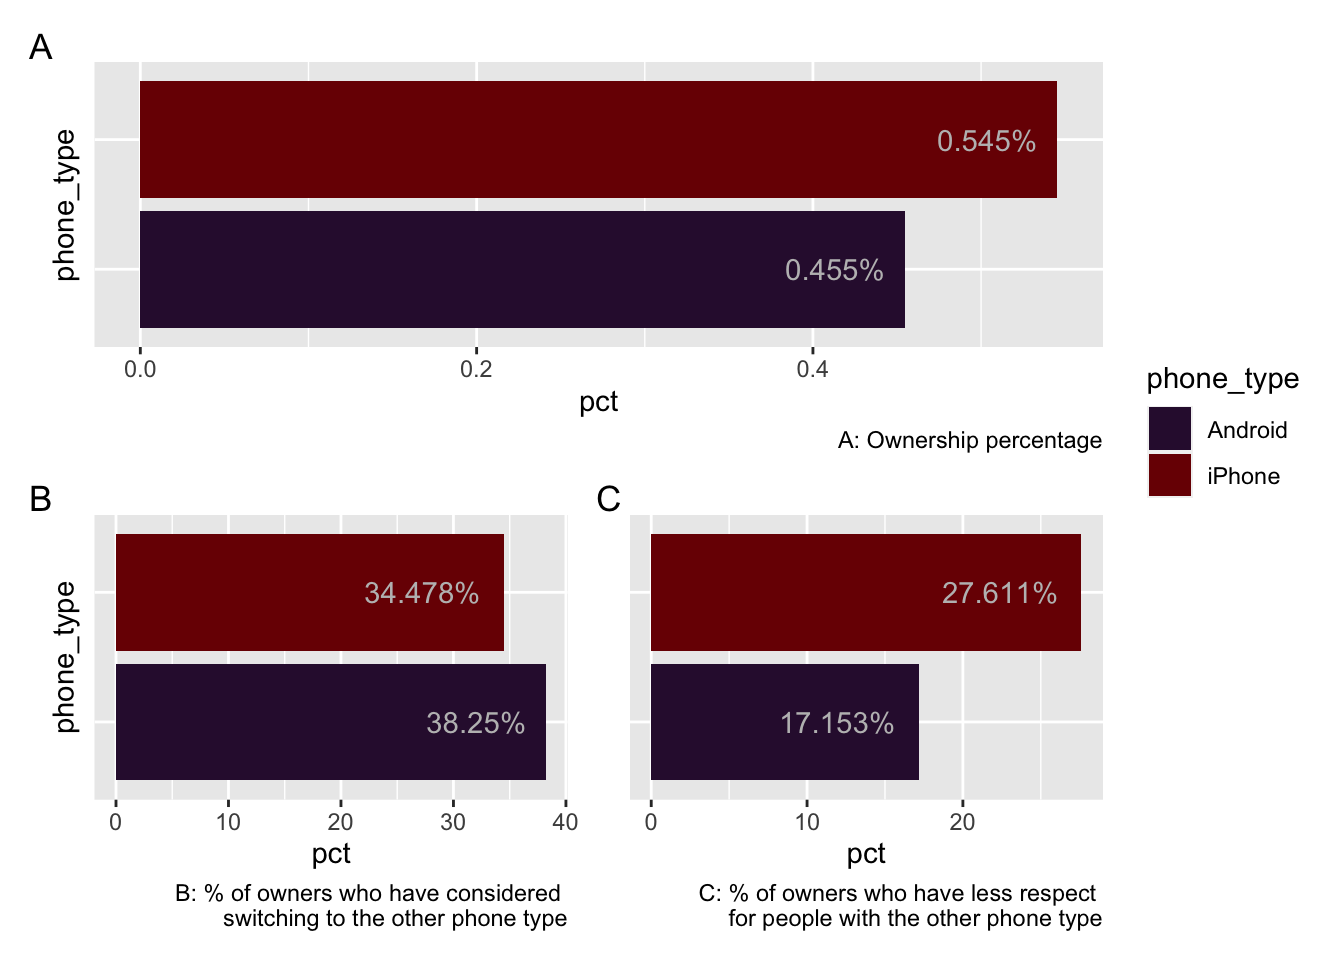
So we can see there is a slight preference for iPhones, and that iPhone owners are more likely to consider switching. iPhone owners are also a fair bit more likely to have less respect for Android owners.
Do bear in mind the source of this data. It comes from a tech magazine and therefore you could assume its reader base has active opinions on this sort of thing. It probably doesn’t reflect the ‘average’ user of a phone.
I hope you have some fun with these new packages - I certainly had fun making them!